Aploris is a graphing software designed to aid in the creation of insightful charts in business presentations. Aploris integrates with Microsoft PowerPoint and Excel enhancing their capabilities to allow customers to effectively create a variety of well-formed graphs for all sorts of business presentations like sales, finance/controlling, HR, strategy.
Aploris is available on Windows and Apple's Mac OS X operating system.
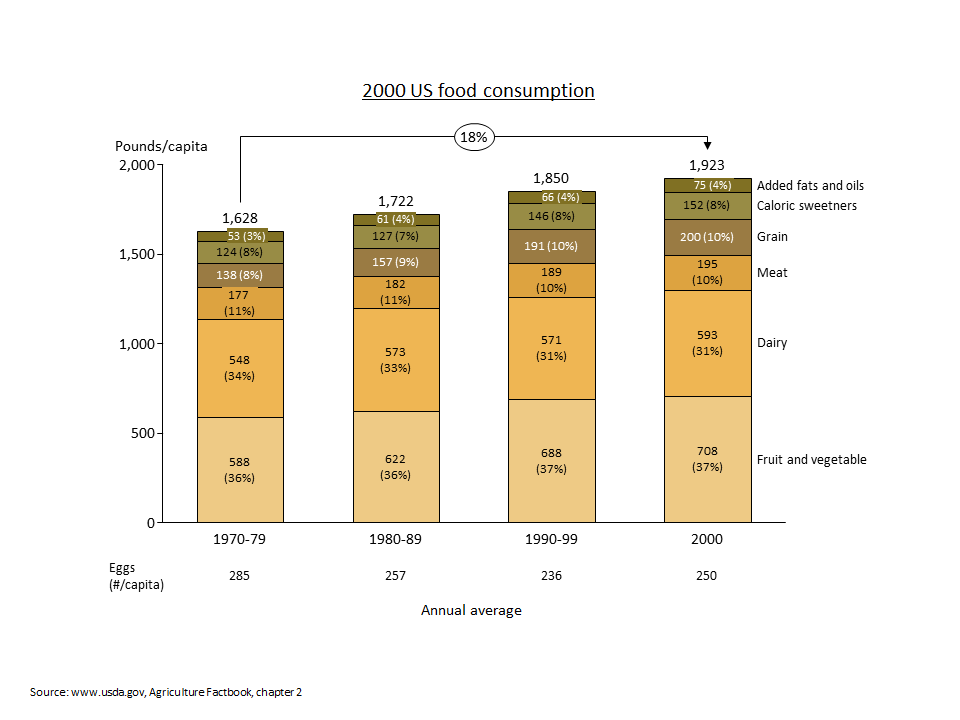
 | Stacked bar |  | Clustered bar |  | Stacked-cluster combination |
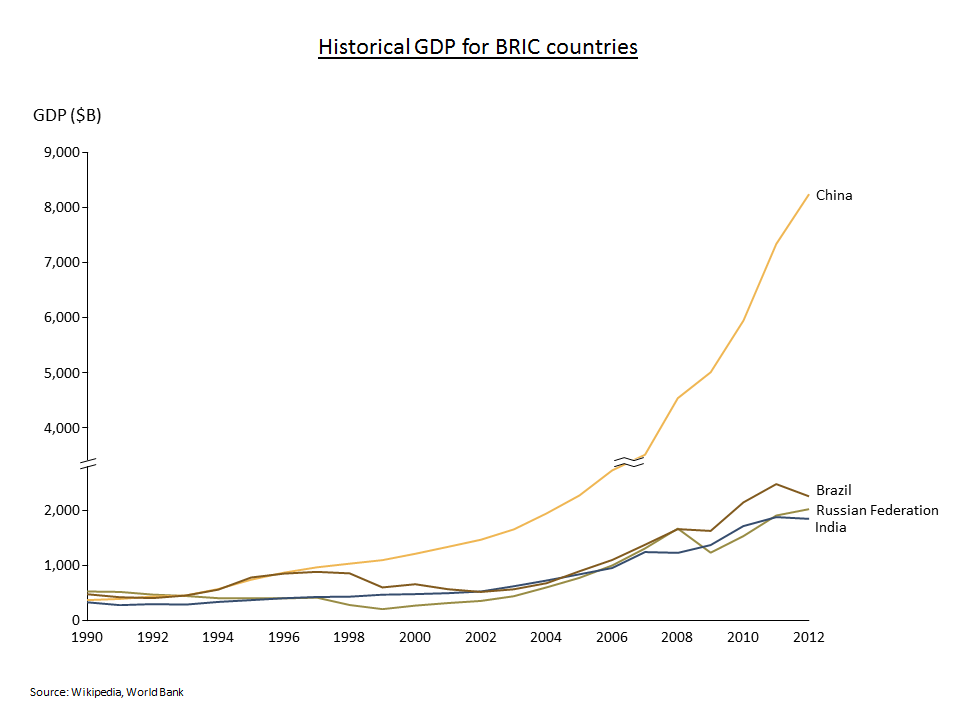
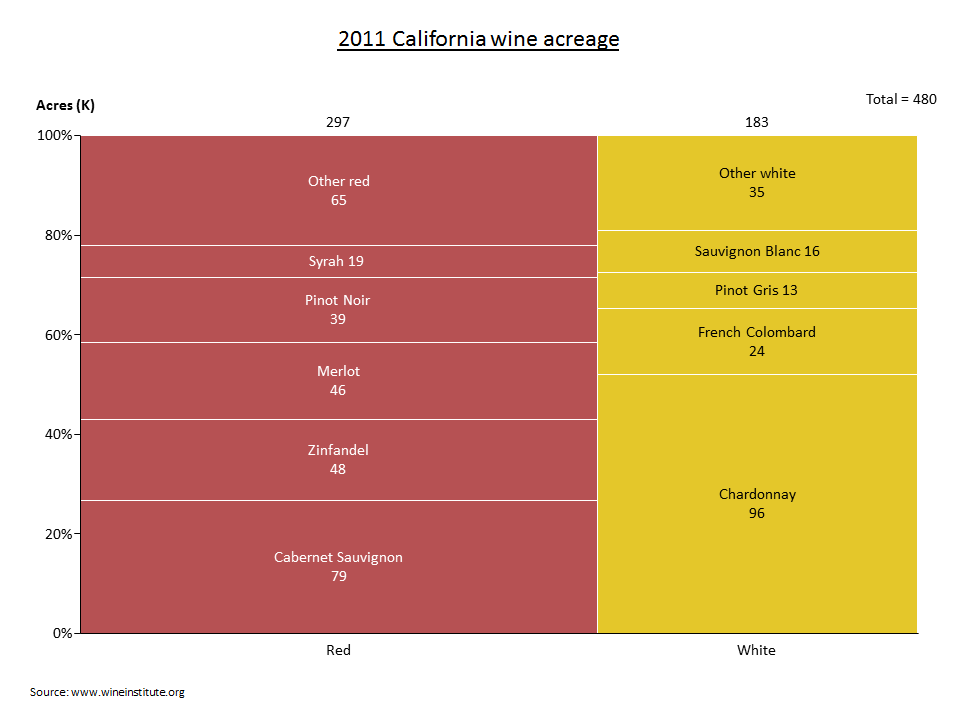
 | Line |  | Area |  | Mekko/Marimekko |
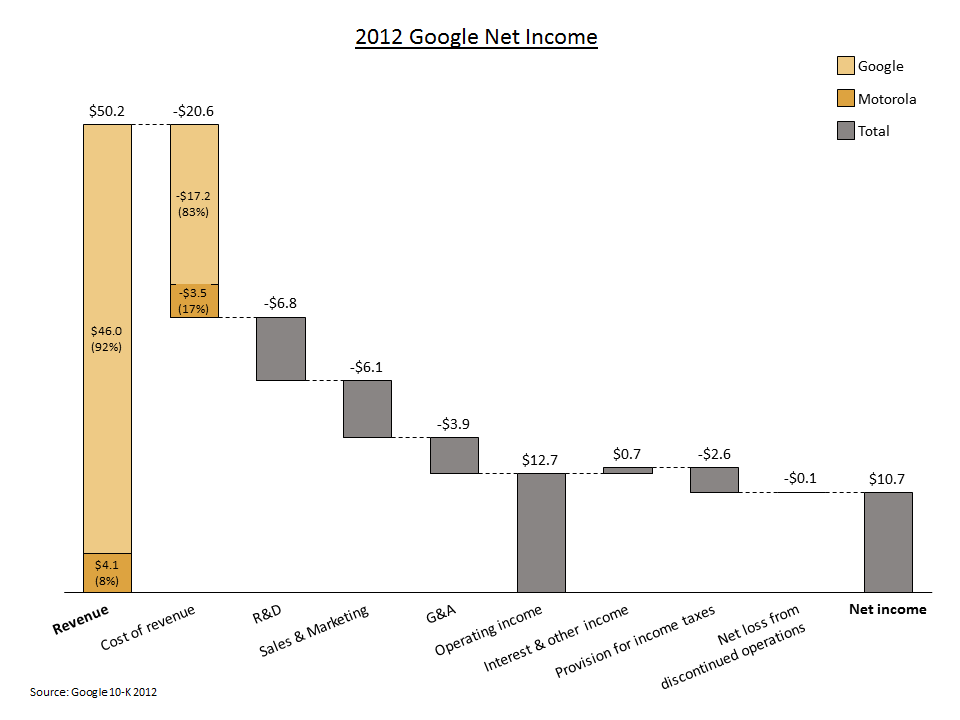
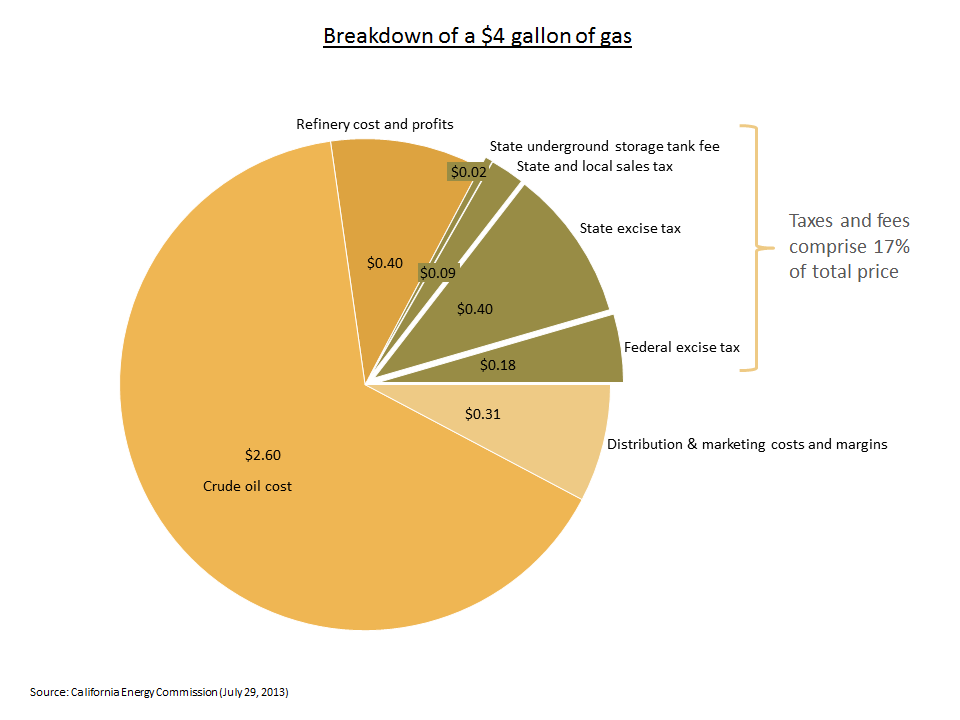
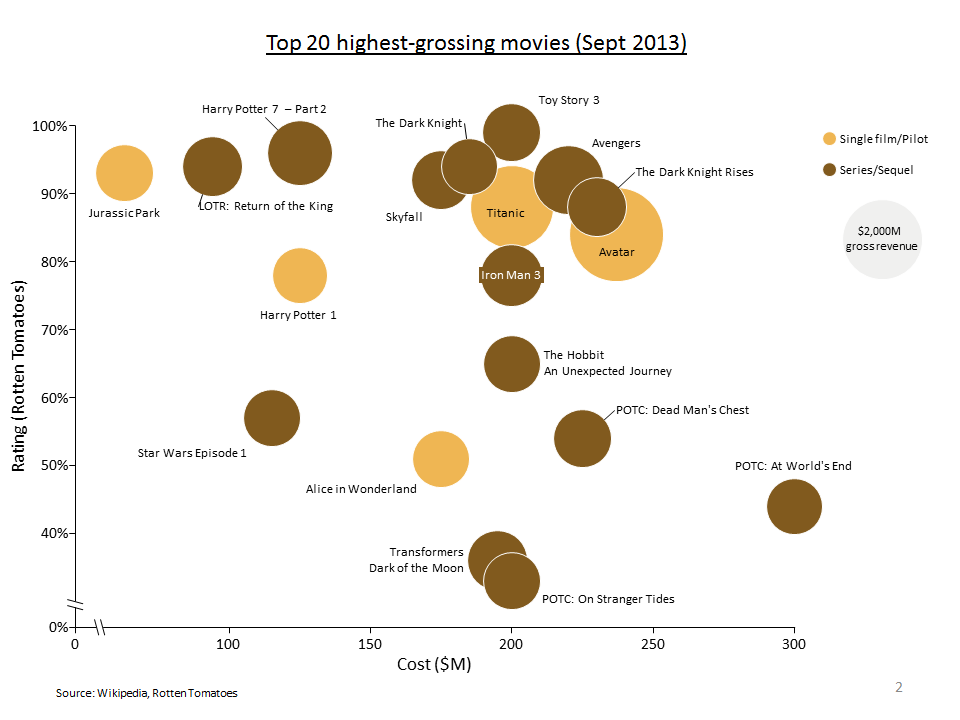
 | Waterfall |  | Pie |  | Bubble |
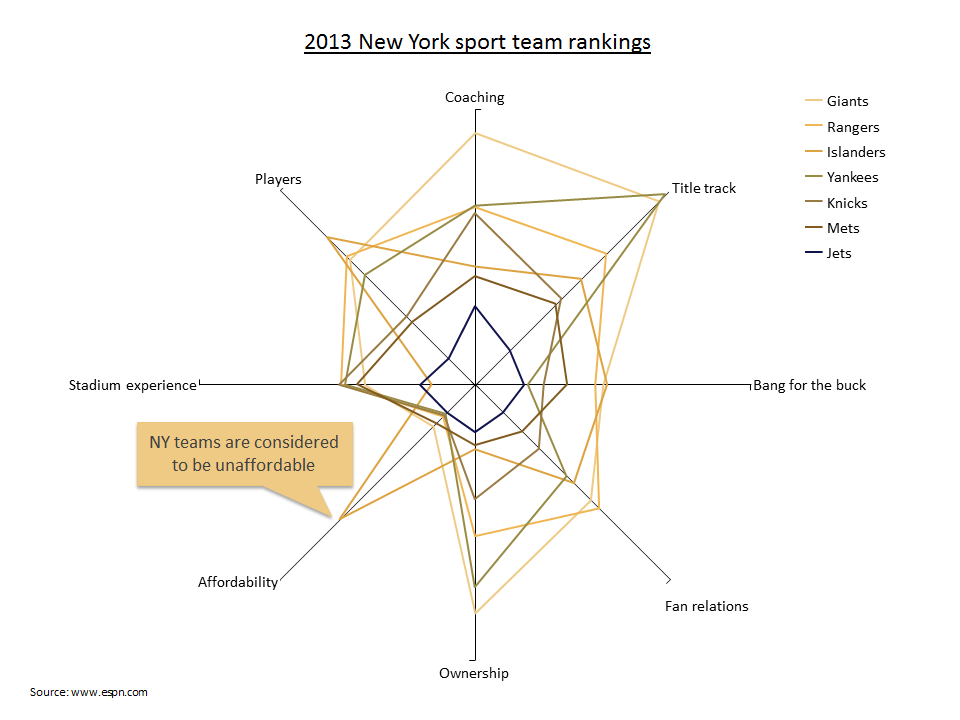
 | Scatter |  | Spider |  | Gantt |
Click on a chart name to preview a sample chart image created using Aploris (if available).
Learn about the powerful chart features