After Aploris for PowerPoint has been installed and activated as described in chapter Installation – Windows you will see a new group in the PowerPoint ribbon when switching to the Insert tab. Using this group you can insert a new chart and have access to other functions.
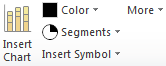
To insert a new chart click on Insert Chart. The mouse cursor changes to a crosshair that allows you to select the position on the slide where the main chart area will be located. To facilitate aligning charts with other objects guide lines are displayed when the current cursor position is aligned with an existing shape or chart on the slide.
Move the mouse cursor to a corner of the desired location, press and hold the left mouse button and move the mouse to the opposite corner. Now release the mouse button which will bring up the chart type selection dialog. To cancel the chart insertion press Esc or click the right mouse button.
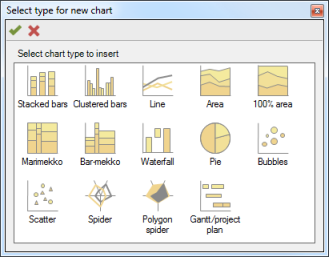
A double-click on any of the chart types or confirming with  will bring up the interactive chart editor described in section Interactive chart editing. To learn more about the individual chart types refer to the appropriate chapter:
To insert a new chart select Open Aploris chart from the Aploris toolbar in PowerPoint. If an existing chart is detected on the slide Aploris will ask you to confirm that you want to insert an additional chart.
The Aploris editor will open displaying a snapshot of the current slide. Use the mouse to select the main chart area for the new chart.
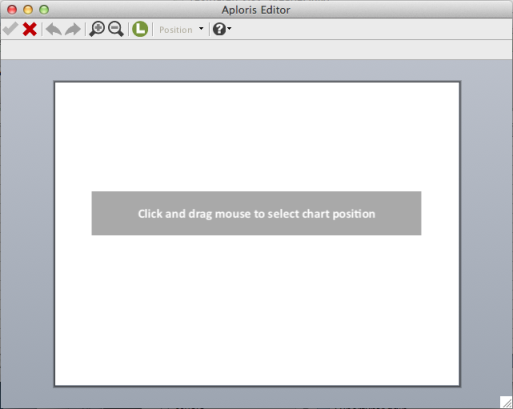
Choose the type of chart that you want to insert as described in Chart insertion (Windows).
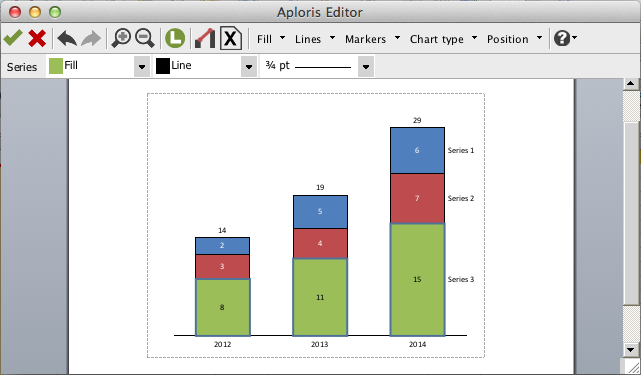
After inserting a new chart or opening an existing chart the interactive chart editor will be displayed. It consists of the main editor window showing the chart, a toolbar on top of the window (“main toolbar”) and the data sheet in a separate window.
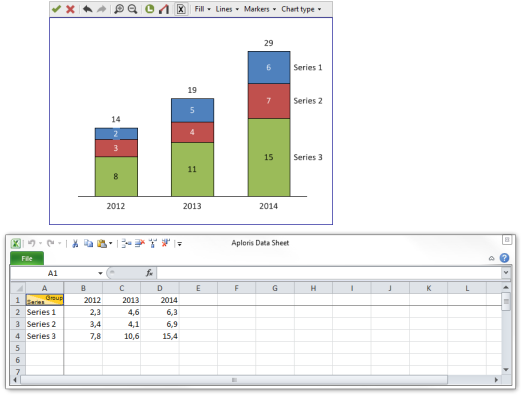
The main editor is used to interactively modify the chart. Some functions are available via the toolbar and described in the corresponding section. The underlying data of the chart is edited in the data sheet window.
On Mac the Aploris editor is usually displayed full screen and the data is opened in Microsoft Excel. Aploris uses the workbook name AplorisData.xlsx. If a workbook with this name is already opened Aploris will ask you to close it. You can then use  to open the current chart’s data sheet.
Note: On Mac due to technical restrictions PowerPoint is not accessible while an Aploris chart is being edited. This also means that a different presentation cannot be edited while the Aploris editor is open. Please close the editor to continue editing PowerPoint slides as usual.
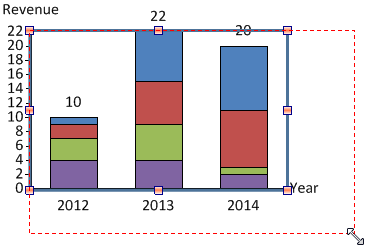
When the mouse cursor is hovering above a selectable object it will display a light orange border to indicate that it can be selected with a mouse click. After selecting the object it will display a blue border.
Selecting multiple objects is possible in number of ways:
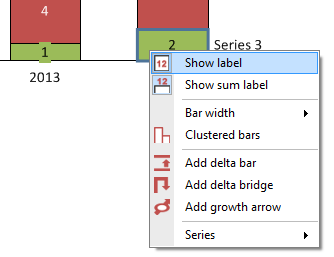
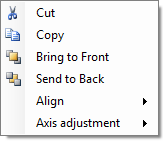
Click the right mouse button on a selected object to open its context menu with actions relevant for this object type. Context menu actions are applied to all currently selected objects if possible.
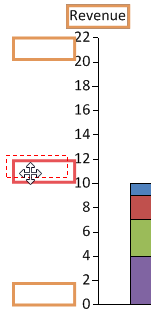
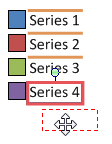
When the mouse cursor hovers over an object for which the position can be changed by dragging the object, the cursor symbol will take the move cursor shape known from PowerPoint. If arbitrary positions can be chosen for the object at hand a red outline shape will follow the mouse cursor displaying the position that the object will take when the mouse cursor is released.
Labels can also be moved using cursor keys ← , → , ↑, ↓. As in PowerPoint the move distance is smaller when used while Ctrl is pressed.
If the object has one or more default positions they will be displayed as orange outlines on the screen. Moving the object close to one of its default positions will make it snap, use the Alt key to move an object close to a default position without snapping. When multiple objects are selected and one of them is dragged to snap to a default position, all selected objects will move to their respective default position. Otherwise all objects are moved in the same direction by the same distance.
As in PowerPoint the Shift can be used to move an object only horizontally or vertically.
Objects that support rotating will display a light green rotation handle when selected. Grab the handle and move the mouse cursor to change the rotation. If applicable, objects will snap to sensible defaults when rotating. You can use the Alt key to override this behavior. For other objects pressing the Ctrl key will restrict the rotation to exactly horizontal, vertical or diagonal positions.

Objects for which the size can be changed interactively will display resize handles when selected. Drag any of the handles to resize the object.
Properties of an object like its color or number format are accessible in the object toolbar. With Aploris for Windows it resembles the mini toolbar known from Microsoft Office which appears close to the current selection.

With Aploris for Mac the object toolbar appears docked at the top of the windows below the main toolbar. The object toolbar is automatically displayed when one or more objects are selected. If it closes on Windows clicking on any selected object will bring it up again.
The object toolbar will display the currently configured values of the selected object(s). Use the buttons and/or drop-down boxes to change the properties. The number and selection of properties depend on the type of objects selected. Label properties are discussed in chapter Labels.
If the selected objects have different settings regarding a specific property an empty value will be displayed. A newly selected value will be applied to all selected objects. Keep in mind that values can only be applied to objects supporting the respective property, e.g. changing the line color is only possible for labels that support displaying a frame (like Growth arrow captions).
General commands that are not specific to any object are available from the toolbar on top of the main editor window.

Use Save changes to save all changes since opening the chart to the PowerPoint slide.  Discard changes closes the chart and discards all changes so the PowerPoint slide is not modified.
 Undo and
  Redo are used to undo the last operation or to redo the last undo. These commands are also available with the shortcuts Ctrl+Z (Undo) and Ctrl+Y (Redo).
 Zoom in and
  Zoom out will increase/decrease the zoom level used to display the chart. These command are also available with the shortcuts Ctrl+ + (Ctrl and + key, Zoom in) and Ctrl+ – (Zoom out). If your mouse is equipped with a scroll wheel you can access these commands even more easily by holding the Ctrl and turning the mouse wheel up (Zoom in) or down (Zoom out) as in PowerPoint.
The main editor window automatically increases its size when objects are dragged outside its current boundaries. You can also adjust the borders manually by dragging the window border. This way you can crop unnecessary white space or create additional space, e.g. for legend or annotation data. Adjusting a border is not possible when it is outside the visible area. In this case, zoom out or scroll to make the border visible.
When the chart is not entirely visible you have several options to scroll the view:
To change the zoom level you have the options described in General commands – main toolbar:
Zoom in and Zoom out in the toolbar.In PowerPoint Aploris charts appear like regular PowerPoint shapes that can be selected, moved, resized and deleted as usual. Adjusting z-order and aligning objects is also possible using PowerPoint’s built-in buttons.
To open an Aploris chart for editing double-click on any of the shapes that make up the chart or select the chart by clicking on a shape and press .
Moving the chart is possible by clicking and dragging any of the shapes. Alternatively, the chart(s) can be selected and shifted on the slide using the ← , → , ↑, ↓ keys like regular PowerPoint shapes. After selecting a chart it can also be resized using the handles on the borders just like PowerPoint shapes.
While moving or resizing a chart you will notice guide lines that are displayed when the chart area is aligned with any other shape on the slide. The chart snaps to these aligned positions unless Alt is pressed to override this feature.
Note: When selecting or dragging an Aploris chart make sure to click on any of the shapes of the chart. Otherwise you will “click through” the chart and the chart does not recognize the mouse click (like other concave PowerPoint shapes).
To copy, cut, paste and align Aploris charts simply use the familiar PowerPoint commands and shortcuts. These are also available from the chart’s context menu.
In some cases you may want to align the axis scales of multiple charts so that their lengths are proportional to the covered ranges. E.g. if a chart has a height of 4 inches or centimeters and the value spans a range of 0 to 8, another chart displaying a range from 0 to 6 should have a height of 3 inches or centimeters. Likewise, a chart with 6 category groups may need to be twice as wide as another with 3 category groups.
Aploris lets you easily adjust the scales so they match between multiple charts. To use this feature select the charts that you want to adjust, bring up the context menu and select an item from Axis adjustment. The chart(s) with the bigger scale will then be scaled down to match the smallest scale of the selected charts.
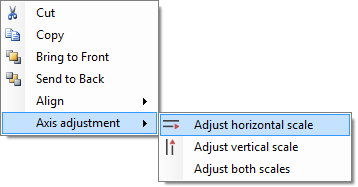
You can choose to adjust either the width or the height of the charts or both. Aploris will automatically determine if an axis displays a value range or a number of category groups and make appropriate adjustments. Note that due to the structural difference between both types the adjusted axes of all selected charts must be of the same type.
For an axis featuring an axis break adjusting the scale is not possible. If an adjustment would result in a very small chart because of a large difference between the axes, Aploris will also display a warning and aborts the operation.
When Aploris is not installed or deactivated Aploris charts appear as a group of native PowerPoint shapes. This means that any application capable of displaying PowerPoint slides will show Aploris correctly.
A user may make modifications to an Aploris chart when Aploris for PowerPoint is not available using PowerPoint’s built-in functions.
On the Mac Aploris charts will always appear as a group of native PowerPoint shapes which can be edited directly. The chart can be moved and resized, however, we recommend resizing the chart using the Aploris editor which ensures that all required adjustments are made.
When the chart is opened in Aploris again, it will try to integrate the changes made without Aploris. Some adjustments like color or text format changes can usually be updated in the Aploris chart automatically. Aploris also tries to include a resize operation that has been made without using Aploris. Since additional changes may have been made at the same time Aploris displays a warning in this case. The user should check if any manual adjustments are required.
Other changes like position shifts of objects within the chart cannot be integrated into an Aploris chart automatically. In this case a dialog is displayed to notify the user about changes that were made without using Aploris.
These changes can only be transferred to the chart manually. If you choose Open the latest version saved with Aploris the latest saved Aploris version will be restored and displayed in the interactive chart editor (including changes that can be integrated automatically). Additionally, the current version of the slide that shows changes that were made without Aploris is shown in a window Slide reference.
The Modified version window can be adjusted in terms of position, size, zoom to show the required details of the modified chart. Selecting a region using the mouse will zoom in to this region, alternatively left double-click, + or Ctrl +mouse wheel up can be used. –, Ctrl +mouse wheel down or a right double-click zoom out.
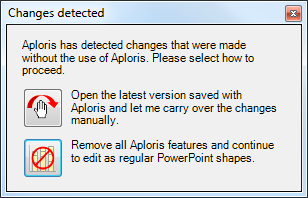
If you do not want to use the chart with Aploris anymore, select Remove all Aploris features. This will convert the Aploris chart to regular PowerPoint shapes which can be edited using the built-in PowerPoint functions. It is not possible to transform the shapes back to an Aploris chart later.
On the Mac a warning is displayed when changes were detected and the window Slide reference is shown.
The data defining an Aploris chart is entered into the Aploris data sheet. Any data entered or modified in the data sheet is automatically updated in the visual chart.
On the Mac there may be a short time lag when transferring modified data from the data sheet in Excel to Aploris. You can accelerate the process by clicking Save in Excel.
By default the data sheet is opened together with the chart when a new chart is inserted or an existing chart is edited. To hide the data sheet when not required and to show it again use Show/hide data sheet from the main toolbar.
Aploris for PowerPoint uses a Microsoft Excel worksheet for its data sheet. This means that most Excel features like copy/paste, moving cells or entering formulas are available. You may notice that Aploris adds descriptive labels and color to the worksheet depending on the current chart type and settings. These only provide visual guidance and do not interfere with data input and manipulation. On the Mac descriptions included in the data sheet as cell comments indicated by a red triangle in the upper right corner of a cell. Hover the mouse cursor above the cell to see the description.
In general, data is entered in rows and columns where each row and column has a description in its first cell. Only for bubble/scatter and pie charts the column description is optional due to the nature of the underlying data. Rows and columns which do not carry a description, i.e. the first cell is empty, will not be included in the visual chart. This means that rows and columns that shall not be displayed can easily be hidden by clearing the first cell. This way cells in blank rows and columns can also be used for auxiliary calculations or to add descriptive information.
A new chart is filled with illustrative data from which you can easily tell the pattern in which your own data needs to be entered or copied into the worksheet.